First and second prize in the 2024 competition (and the winners of the 2024 Golden and Silver pinecones) were earned by the Technical University of Munich and the University of Queensland. In total, nearly 200 predictions from 29 different countries were submitted to the 2024 competition. Teams of at least 3 individuals from the same University or Research Institution are needed for a chance to win best team prediction. The first and second place teams of this competition earn our coveted golden and silver pinecones.
This year’s competition will take place on Wednesday, December 17, 2025, at 12 p.m. (EST). All HRR predictions received prior to this date will be scored for the competition. Please see the invitation to participate at the top of the page.
Competition Tree Information
| Species |
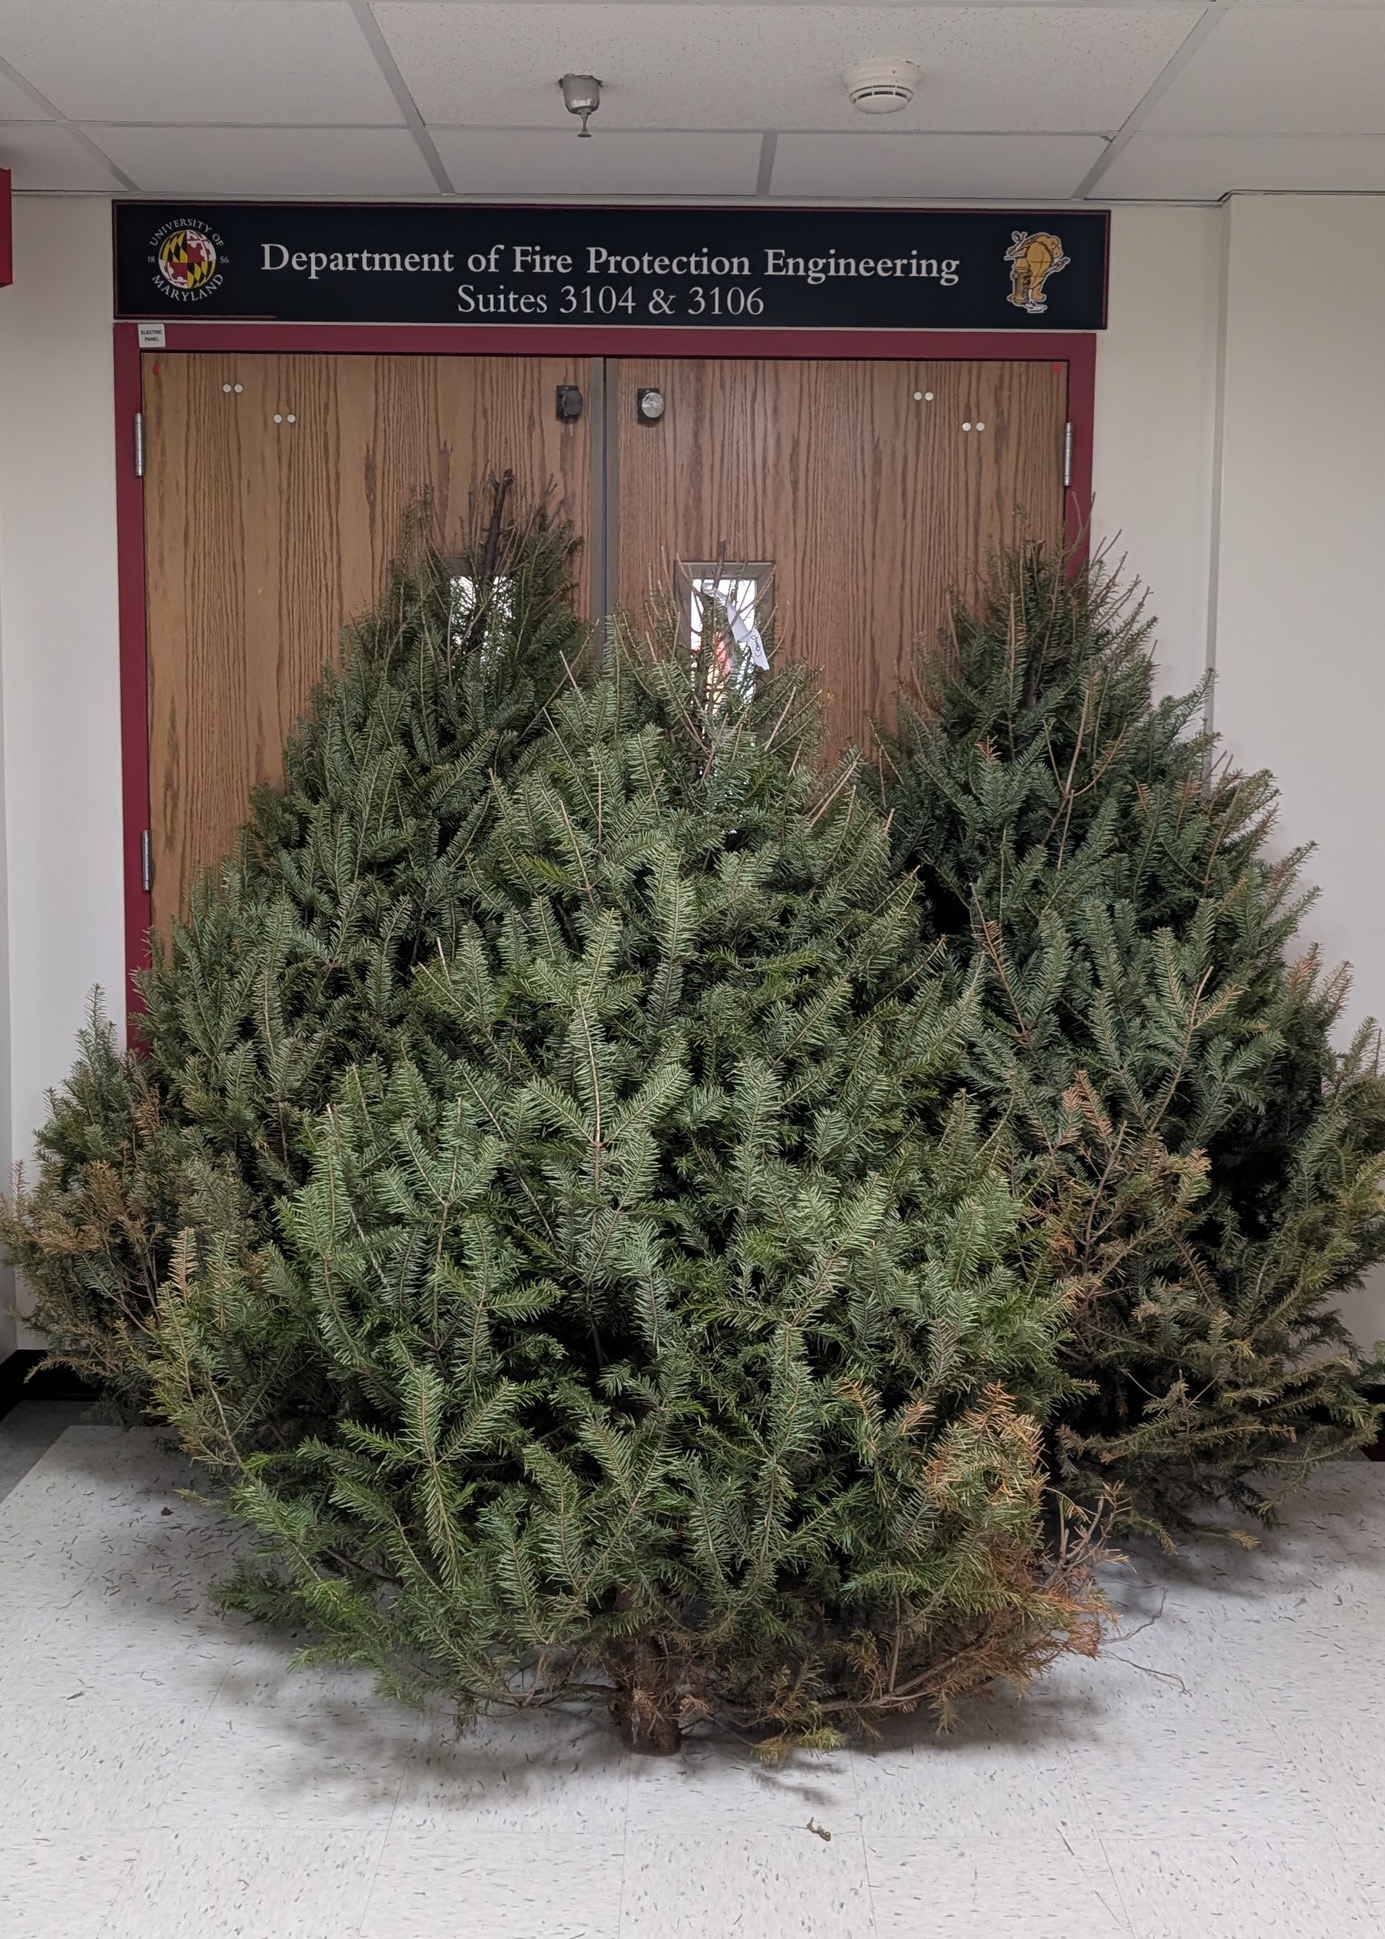
Canaan Firs. The three competition trees are pictured in Fig. 1. |
| Height |
Tree 1: 1.83 m |
Tree 2: 1.85 m |
Tree 3: 2.04 m |
| Width |
Tree 1: 1.20 m |
Tree 2: 1.30 m |
Tree 3: 1.18 m |
| Pre-Test Weight |
Tree 1: 5380 g ± 50 g |
Tree 2: 7260 g ± 70 g |
Tree 3: 6580 g ± 70 g |
| Uncertainty in listed heights and widths is estimated as ± 2 cm. |
| Storage |
Trees will be kept unwatered for 16 days in lab storage at approximately 20 C. |
| Ignition |
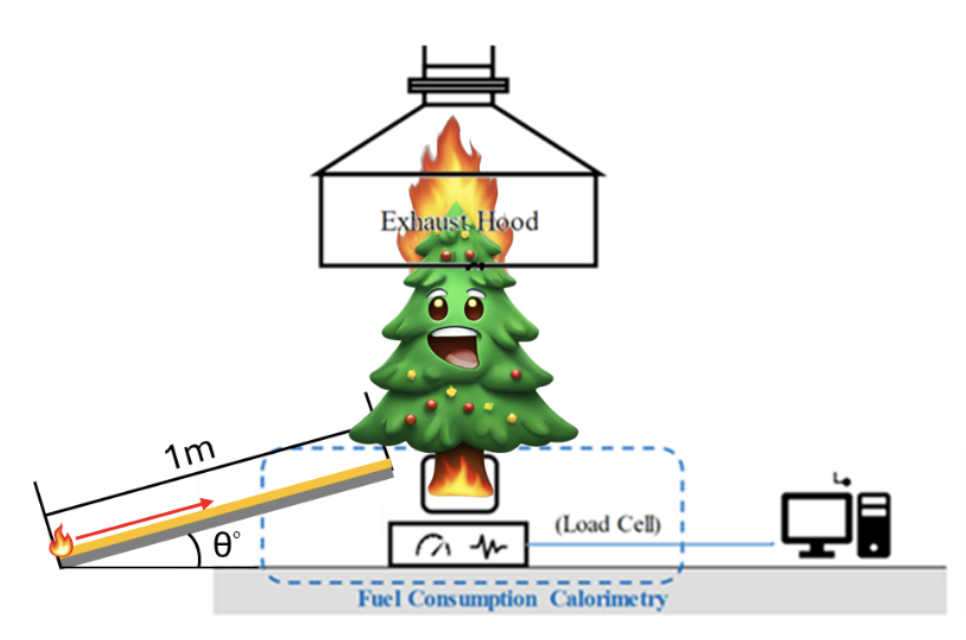
This year’s ignition source is unique (Fig. 2): a 1 m long, 30 cm wide tray with a 6 cm to 10 cm deep layer of excelsior will be placed next to the base of the tree. The tray will be angled 30 degrees from horizontal and ignited at the far end away from the tree. This does not represent a typical Christmas tree fire ignition scenario but it is relevant to flame spread and burning behavior of trees in wildland fires.
Time, t = 0 s is defined as the time when the excelsior is first ignited. Tree ignition time will be defined as the earliest time at which calculated HRR exceeds 50 kW.
|
| Data |
Christmas tree mass loss rate (MLR) will be measured continuously at 1 Hz using a mass balance with a 0.1 g precision. If possible, cone calorimeter measurements will be performed to determine a representative heat of combustion, ΔHc, for each tree. If not, a constant value will be assumed – ΔHc = 17.7 kJ/g [Mell et al. 2009] – and heat release rate will be calculated as: HRR=MLR×∆Hc. |
 |
 |
| Figure 1: Competition Trees |
Figure 2: Schematic of the test setup. |
How to Participate: Generating and Submitting Your Predictions
This year’s competition will take place on Wednesday, December 17, 2024, at 12 p.m. (EST). All HRR predictions received prior to this date will be scored for the competition.
This year, the submission (and generation of) predicted heat release rate (HRR) curves will once again be made possible by visiting NIST’s Christmas Tree Heat Release Rate (HRR) page. We have updated this year’s curve generator to match expected fire size and allow for greater control over fire growth time. This custom-made app that allows participants to ‘build’ (and submit) a design fire curve by adjusting just four parameters that define:
- Peak Heat Release Rate (Peak HRR, kW)
- Total Heat Released (MJ)
- Ignition Delay Time (s)
- Initial Fire Growth Profile / Relative Time to Peak HRR
In this app, after you click ‘Submit by Email,’ an email will be generated that contains the three parameters defining your HRR curve. In this email, please remember to add your name, email address, and lab affiliation if you wish to receive credit (and final competition results) and click send so that we receive your submission.
If you are having trouble automatically generating an email using the ‘Submit by Email’ button, please:
- Click the ‘Copy Entry’ button to copy your submission entry text
- Paste that into the main text field of a new email
- Provide your contact information (do not edit parameter values)
- Make the email subject “HRR Competition”, and;
- Send that email to treehrr@nist.gov
Additionally, a video guide to using this app to create HRR curves and submit predictions is available in Dr. Isaac Leventon’s Youtube Channel.
The Scoring System
This year’s experiments will be repeated in triplicate, and your predictions will be scored with respect to the average and uncertainty of repeated results; expanded measurement uncertainties are calculated as per the table below. Points (100 possible) will be awarded in 5 categories as listed below. Our scoring system will award up to 20 points for each category so long as the predicted values are within the calculated uncertainties.
| Description |
Uncertainty calculated as: |
| Peak Heat Release Rate |
Propagation of error including uncertainty in (1) time-resolved balance reading, (2) heat of combustion, and (3) standard deviation of repeated measurements |
| Total Energy Release |
Propagation of error including uncertainty in (1) steady-state balance reading, (2) heat of combustion, and (3) standard deviation of repeated measurements |
| Time to Ignition |
Measurement range (upper/lower bounds) |
| Time to Peak HRR |
Measurement range (upper/lower bounds) |
| Duration for which HRR Exceeds 20% of Peak |
Measurement range (upper/lower bounds) |
Questions? Please contact the fire safety demo leader, Dr. Isaac Leventon (leventon@umd.edu).